S&P 500
The Standard and Poor 500 index is the de facto benchmark for the US stock market. It tracks the performance of the 500 largest publicly traded US companies. The composition of the index is highly diversified, covering 11 sectors of the US economy. The index includes technology giants such as Apple, Google, Facebook and Nvidia, well-known household names such as Johnson and Johnson, McDonald’s and Pfizer, and industrial behemoth such as Boeing, Caterpillar and Honeywell. It is not an exaggeration to say that the S&P 500 index represents the strength of the US economy.
Why Invest in S&P 500 Index
•The S&P 500 is made up of high quality, blue-chip companies with the track record of consistent earning growth and profitability.
•The S&P 500 is highly diversified, spanning all 11 sectors of the US economy. In a rapid changing world with increasing uncertainty, it provides some much needed protection and stability.
•It is very easy to invest in the S&P500 index. The index is tracked by many index funds with huge liquidity (such as SPY) and very low management fees (such as SWPPX and VFIAX).
•The S&P 500 boasts a compound return of 9.3% (excluding dividend) over the past 15 years. The annual dividend yield varied from 1.5 to 3.2 percent.
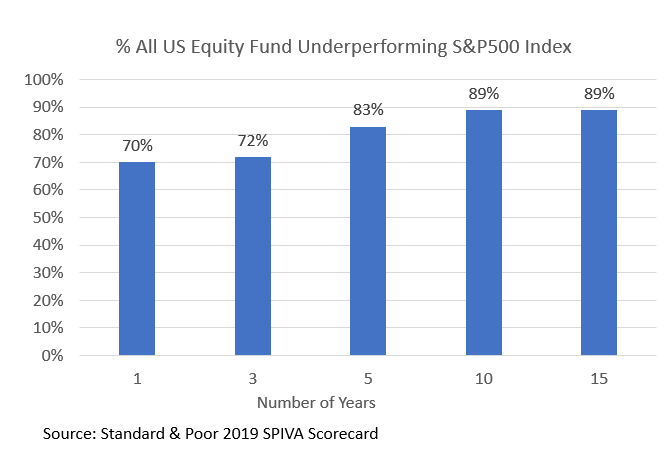
•Amazingly, the S&P500 index has outperformed nearly 90% of all US equity funds over the long run. No wonder Warren Buffett, one of the most successful investors of all time, said that for ordinary investors, buying the S&P 500 index is likely one of their best choices.
The Risk
As appealing as it is, investing in the S&P 500 index in the past has proven to be everything but a smooth ride. In the century long history of the index, there have been multiple major downturns. The following are some of the well-known peak-to-trough drawdowns in percentage and the durations between the beginning of the downturn and the full recovery of the index
•34% (2020, Covid) – Recovered in 0.5 years
•55% (2008, Housing Bubble Burst) – Recovered in 4.5 years
•47% (2000, Dotcom Bubble Burst) – Recovered in 14 years
•50% (1973, Oil Crisis) – Recovered in 14 years
•84% (1929, Great Depression) – Recovered in 30 years
Even though the index eventually recovered from all the downturn periods, witnessing a significant portion of your hard-earned money disappearing in a matter of months, or in some cases days, can be extremely painful and depressing. The recovery may also take a substantial amount of time, which can bring hardship to those who cannot afford the waiting.
The Million-Dollar Question
So here is the question all of us would ask: is there a S&P500 index based trading strategy that allows high return while protecting the capital during the market downturn? Before we can answer that question, there are a few constraints we need to put forward. We all have seen plenty of “tips” and “advices” out there that claim to offer mouth-watering returns that is neither back by data nor sound reasons. Many of the trading methods recommended are impractical, hard to follow or out-right risky for ordinary investors. These “strategies” typically involve:
- Day Trading / High Frequency Trading
- Leveraged Trading
- Complex Derivatives
Speaking from my personal experience, having paid my fair share of the “tuition” and experienced the stress and disappointment of the results, I will not touch any of the above methods with a ten-foot pole.
The Tactical Strategy
Through years of research and test, my colleague and I have developed a tactical strategy that allows identifying near-term market trend using the information from three major sources:
- Trend in Index Price
- Option Price
- Bond Yield Spread
The change in the index price captures the market momentum but is not sufficient to make trade decisions on its own due to the significant amount of noise in it. The option prices contain the information for the near-to-medium-term risk assessment for the market while the bond yield spread provides the basis for the strategic positions due to its inherent tie with the risk evaluation of the macro economy. Buy combining the three pieces of information and feed them to a proprietary analytical model, we can evaluate the current market risk and make well-informed index trading decisions in real time.
Ordinary investors often neglect the message from the option and bond markets due to the complexity involved in the analyses, but it is essential for us to realize the magnitude of the two markets and their impact on the stock market. In 2021, options activity in the US exceeded that of the stock market for the first time: The average daily notional value of traded single-stock options has risen to more than $450 billion in the year, compared with about $405 billion for stocks, according to CBOE Global Markets data.
US bond markets make up over $40 trillion in value, compared to the $30 trillion market cap for the domestic stock market. Trading volume in bonds also dramatically exceeds stock market volume, with nearly $700 billion in bonds traded on a daily basis.
Both option and bond markets are controlled by institutional investors with sophisticated risk assessment models that are continuously updated to account for the latest information. The price changes in either of the markets have profound impact on the direction of the stock market.
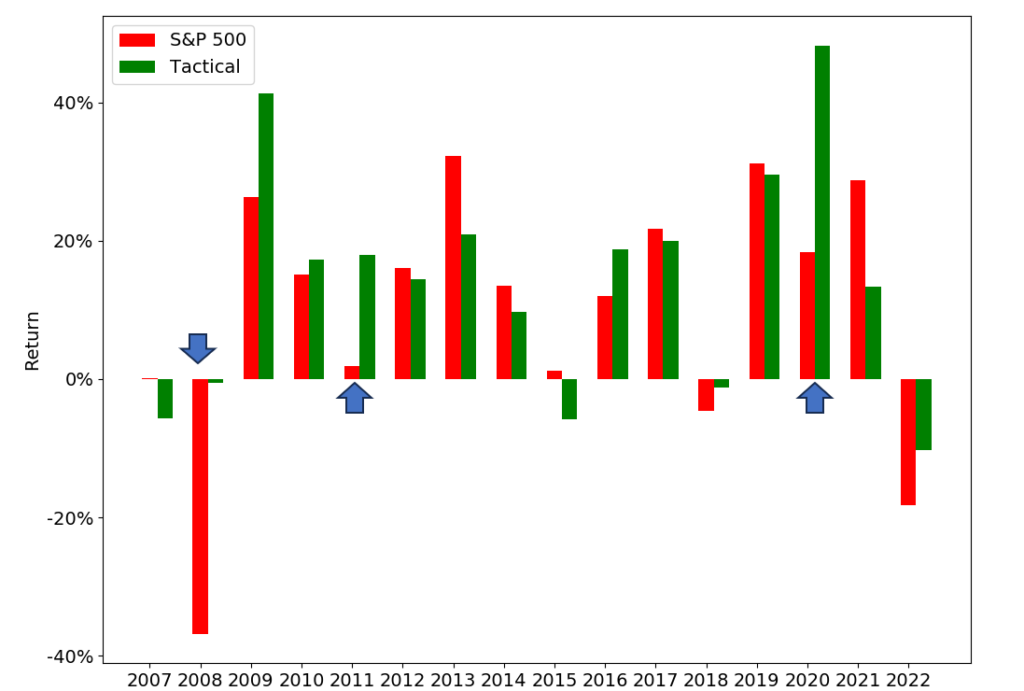
Performance
I have back tested the strategy for the period from April 2007 to August 2023 with the available data. The results are very encouraging.
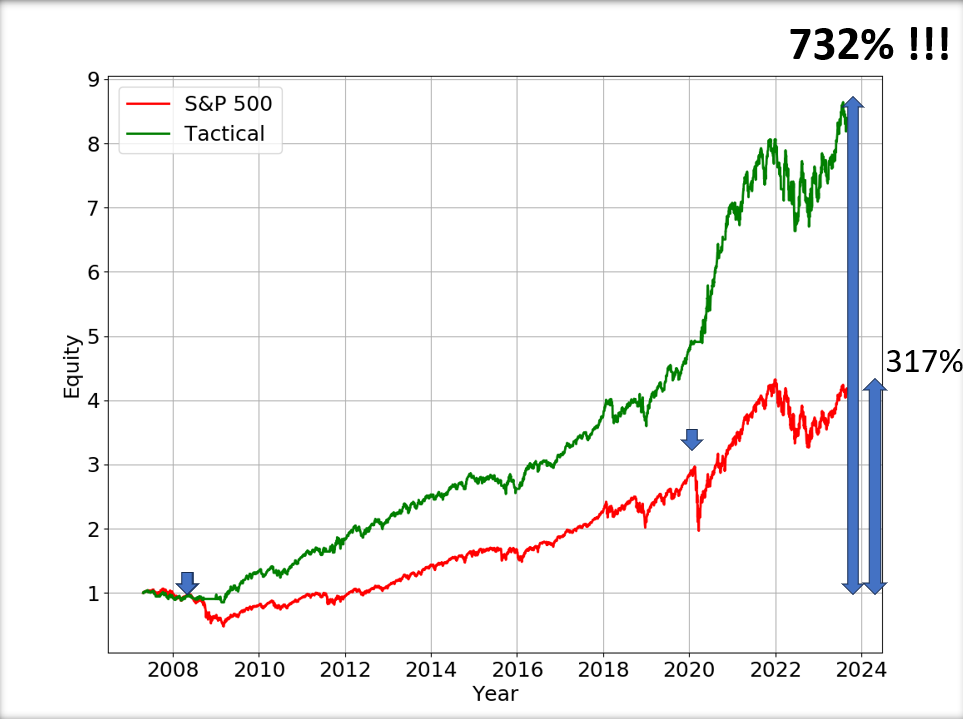
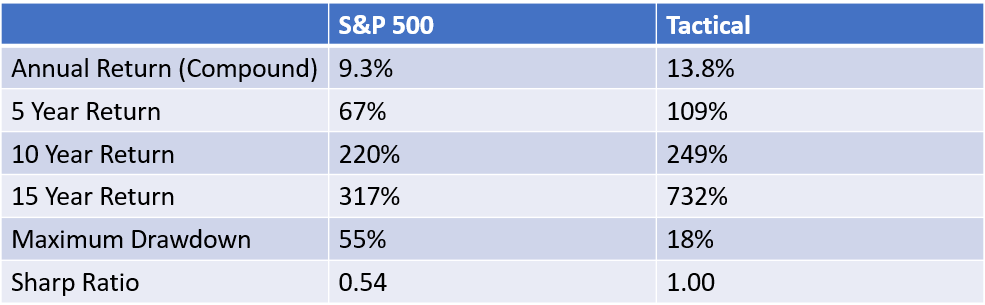
in the period of about15 years, the S&P 500 index has gained a total return of 317%, which equates to an annualized return of 9.3% (excluding dividend) – a very decent number (don’t forget that the index has beaten 90% of the equity funds). During the same period, our tactical strategy has generated a total return of 732%! That is 130% higher than the total return of the index! The annualized return is 13.9%.
More importantly, the maximum drawdown for the S&P 500 index during the test period is 55% while that for the strategy is only 18%. The sharp ratio of the equity curve for the index is 0.54 in contrast to the value of 1.0 for the strategy.
Examining the annual return year by year, one can see that the strategy can capture most of the upside of the index in a bull market, but the greatest benefit of the strategy comes from avoiding the major drawdown periods – such as those during 2008, 2011 and 2020.
Execution
I started to implement the strategy using my personal trading account in 2021. The execution has been straight forward. I use SPY as the investment vehicle due to its high liquidity and the flexibility of trading in the extended hours after the market close. I typically run the model 5 minutes before the closing bell. If a buy or sell signal is triggered, the execution can be done near the market close or during the extended period after the close. I have also run a back test to check the sensitivity of the results to the delayed execution at the market open the next morning. There is a slight deterioration of the results: the total return reduced from 732% to 677% and the maximum drawdown increased from 18% to 21%, but they are still very good numbers.